Two interfaces are provided to mapping funcitonality in R. fcds_map() uses
ggplot2::geom_sf() and fcds_map_leaflet() uses leaflet::leaflet() to
create static and interactive plots of the input data. The defaults of both
functions are designed to work with fcds data, in particular after an
age-adjusted rate has been calculated.
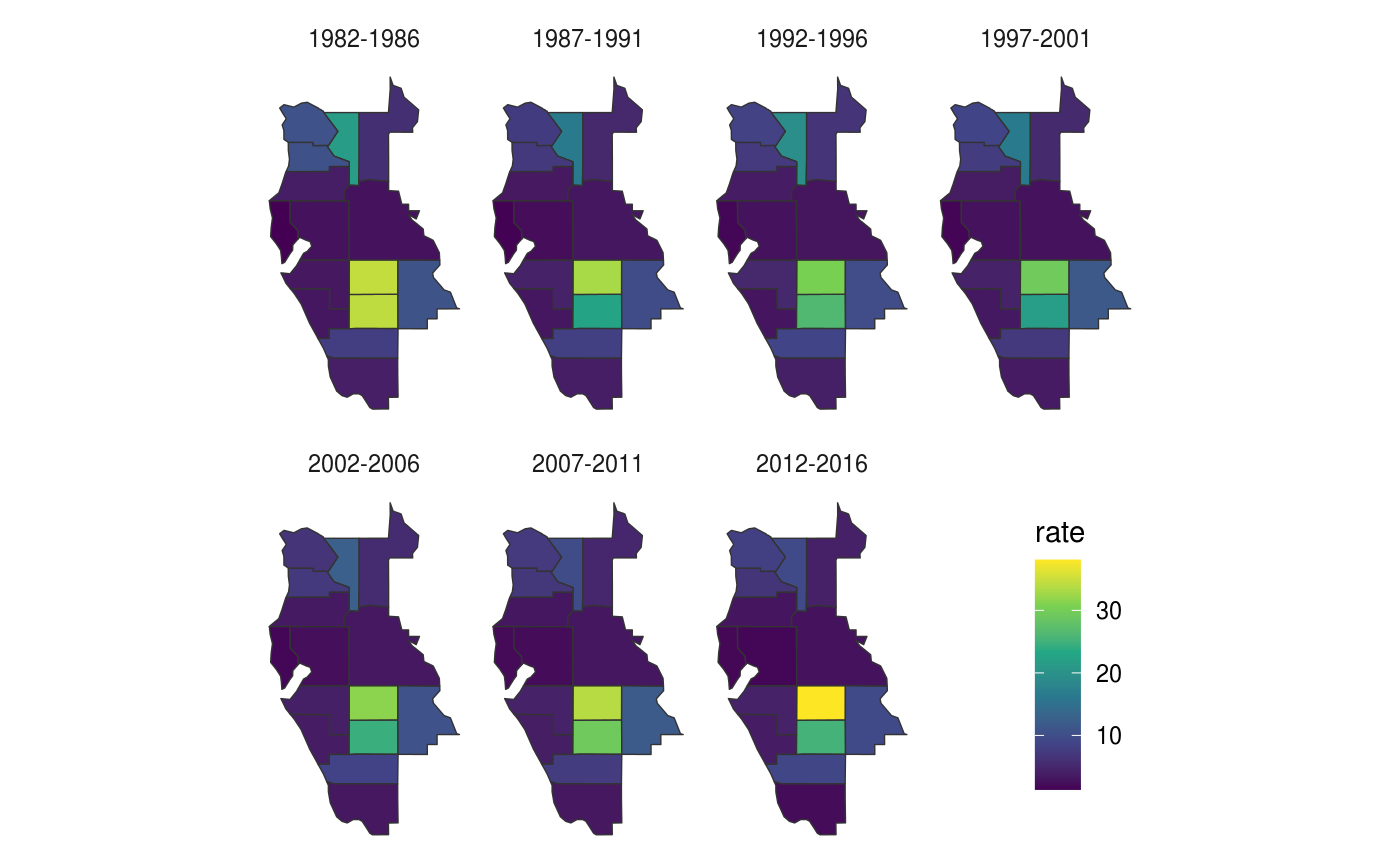
fcds_map_add_label(data, ...)

fcds_map(data, ..., fill = rate, geom_sf.color = "grey20",
  geom_sf.size = 0.25, coord_sf_hide = TRUE,
  theme = ggplot2::theme_minimal(),
  scale_fill = ggplot2::scale_fill_viridis_c())

fcds_map_leaflet(data, ..., palette = "Blues", palette_bins = if
  (length(palette == 1)) 5L else length(palette),
  group_name = "year_group",
  group_labels = rev(fcds_const(group_name)), proxy_id = NULL)
Arguments
| data | A data frame containing FCDS data. At a minimum either
|
|---|---|
| ... | Ignored in Additional arguments passed to Additional arguments passed to |
| fill | The unquoted column name to be used for the fill aesthetic.
Defaults to |
| geom_sf.color | The color of the |
| geom_sf.size | The size of the |
| coord_sf_hide | If |
| theme | The theme to be applied to the plot, by default
|
| scale_fill | The fill scale to be applied to the |
| palette | Set the color palette of the shape fill. You may provide a
vector of colors that will be used for the palette. The number of colors
provided determines the number of bins for the values mapped to the fill,
unless specified by |
| palette_bins | The number of bins in the color |
| group_name | Character name of the column in |
| group_labels | Labels for the group levels in the column referenced by
|
| proxy_id | If provided, a |
Value
A ggplot2 plot object
Functions
fcds_map_add_label: Add a column with the name "label" to the input data. The...are passed toglue::glue_data(), so you can construct labels row-wise with references to the column indata.fcds_map_leaflet: Creates an interactive map usingleaflet::leaflet().
Examples
fcds_example_rates <- fcds::fcds_example %>% count_fcds(moffitt_catchment = TRUE) %>% complete_age_groups(county_name, tidyr::nesting(year_group, year)) %>% age_adjust() %>% dplyr::ungroup() %>% dplyr::mutate(rate = rate / 5) %>% dplyr::mutate(year_group = factor(year_group, unique(year_group)))#> Warning: The moffitt_catchment argument is deprecated, please use county_name = "moffitt"if (all(fcds:::suggests_package(c("sf", "ggplot2")))) { fcds_map(fcds_example_rates) + ggplot2::facet_wrap(~year_group, ncol = 4) + ggplot2::theme(legend.position = c(0.93, 0.25)) }if (FALSE) { fcds_map_leaflet(fcds_example_rates) }